

I Didn't Move, You Did
Why every political chart is lying to you about the centre

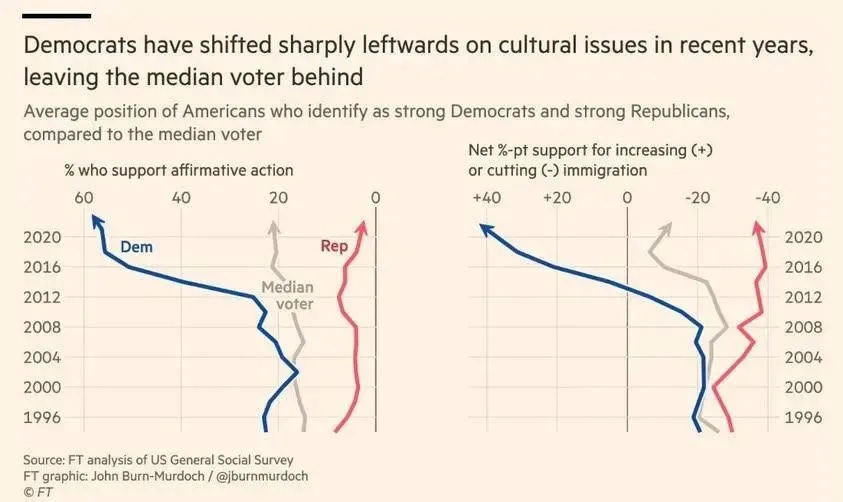
This chart is doing the rounds. You have probably seen it. John Burn-Murdoch made it for the Financial Times. It shows that strong Democrats have shifted sharply left on cultural issues since 2012, while Republicans have barely moved. The median voter sits in the middle looking sensible.
The headline says: “Democrats have shifted sharply leftwards on cultural issues in recent years, leaving the median voter behind.”
It is a beautifully made chart. It is also nonsense. Not because the data is wrong. Because the frame is.
Let me show you why.
Layer one: the tails are not the story
The chart measures “strong Democrats” and “strong Republicans.” These are the tails of the distribution. The people who identify most intensely with their party.
Of course the tails diverge from the median. That is what tails do. It is like measuring the fastest runners in a race and concluding that running has become more extreme. No. You just measured the fast ones.
The interesting question is not whether the tails moved. It is why the tails accelerated. The chart has nothing to say about that.
Layer two: the asymmetry hiding in plain sight
Look at the right-hand panel. Immigration. Republicans shifted hard to the right from 2000 onwards. That is a massive move. At least as dramatic as anything on the Democratic side.
But the headline does not say “both parties diverged from the median.” It says Democrats moved left. The Republican shift is right there in the data (and the graph). The framing walks past it.
This is not an accident. It is a lens effect.
Layer three: the FT is not neutral
Nobody is neutral. The Financial Times sells to people who think of themselves as the centre. Its readers are institutionalists. They believe the middle ground is a real place with a fixed address.
A chart that says “the extremes moved away from the sensible middle” confirms the prior its audience already holds. It tells FT readers what they want to hear. Which is that they did not move. Everyone else did.
This is not a conspiracy. It is economics. The FT is extracting value from its readers’ self-image. The product is reassurance. The chart is the delivery mechanism.
Layer four: the survey moved the thing it measured
The data comes from the US General Social Survey. The GSS has been asking the same questions for decades. That sounds rigorous. It is not.
“Do you support affirmative action?” means something completely different in 2020 than it did in 1996. The words are the same. The world is not. The question stayed still. The field it is measuring rotated underneath it.
Some of what looks like movement is real preference shift. Some of it is semantic drift. The chart cannot tell the difference. It does not try.
And it gets worse.
The moment these results are published, they become inputs to the system. A politician sees “Democrats shifted left on immigration” and adjusts their positioning. A voter sees the same chart and feels either vindicated or alarmed. A newspaper writes a headline. The headline changes the field. The next survey captures the change the last headline caused.
The measurement moved the thing it was measuring. And nobody at any point says: we are inside this system, not above it.
The buoy and the lighthouse
The median voter line is the real trick. It sits there in the middle of the chart looking neutral. Looking like solid ground. Looking like a reference point.
It is not.
The median is a rolling average of a population that is itself being pushed around by the same forces pushing the parties. It is a buoy on the sea. It moves when the current moves. It is not a lighthouse.
When Democrats shift left on affirmative action, some voters follow them. The median moves. When Republicans shift right on immigration, some voters follow them. The median moves again. The median is not standing still while the parties walk away from it. The median is being tugged in both directions simultaneously and settling somewhere in between, and that somewhere is different every year.
Using the median as a fixed reference to measure party movement is like measuring how far a ship has drifted by comparing it to another ship. Both moved. You just called one of them the anchor.
What is actually happening
Both parties shifted away from the median at the same time. The inflection point is the same: roughly 2012. The acceleration is the same. The cause is the same.
Social media raised the reward for holding extreme positions and lowered the cost of expressing them. Simultaneously. For everyone. The attention economy does not care whether you are left or right. It cares whether you are loud.
The chart records the symptom. It misdiagnoses the disease. The disease is not that Democrats moved left. The disease is that the entire system started rewarding distance from the centre at the same time, and both parties responded rationally to that incentive.
The real story is not directional. It is structural. And a chart that only points in one direction is not telling you the story. It is telling you a story. The one its audience wants to hear.
The phrase that gives it away
Everyone says it. Left and right. Young and old. In every argument, on every platform, in every country.
“I didn’t move. You did.”
They are all right. And they are all wrong. Because the ground moved. The frame of reference shifted. And nobody has a fixed position from which to measure anyone else.
The FT chart is just the prettiest version of that mistake. A beautifully rendered map of a coastline drawn from a boat that forgot it was also at sea.
Matt Pearce writes The Angry Dogs. All Substack proceeds are donated to Ukrainian causes.
>'The chart measures “strong Democrats” and “strong Republicans.'
The studies justification for using the "strong" partisan is that these are individuals who self-identify most intensely with their party's label. They are usually the most politically active, the most likely to vote in primaries, and the most consistent in holding their party's "line" on various issues.
>"Of course the tails diverge from the median."
right. its ultimately about the relative divergence. This is why the strong partisan is used. There would be less divergence if they used the "not very strong" categorization.
>"Republicans shifted hard to the right from 2000 onwards. That is a massive move. At least as dramatic as anything on the Democratic side."
are you reading the chart here or is this your own assessment based on your own perceptions?
Sure you can argue that the headline is maybe biased since its only identifying the shift on the left. This doesnt make the underlying data any more or less true. And one could argue the headline is focusing on the left wing shift because it is more dramatic.
"leaving the median voter behind" is a bit of rhetorical flourish and not an explicit interpretation of the data. But nonetheless the leftward shift is further from the median then the right.
Are you genuinely saying you view the divergence from the median in the right hand chart on immigration for the left and the right as being equally dramatic?
>"FT is not neutral"
ok? There are no unbiased sources especially on political opinions or views.
>"the survey moved the thing it measured"
what affirmative action is ontologically did not change over that period of time. the changes in context and social interpretation are experienced by both sides. just because you dont like the question being asked doesnt mean the data is somehow invalid.
>"The buoy and the lighthouse"
Are you aware of the 7 categories this survey uses? The median voter isn't just some arbitrary thing. The data tracked by the survey is clearly represented in the chart. Your perception of what the median voter may or may not have done is of no concern to this study/survey. Its not a "trick". Its a specific methodology which they have been applying in the same manner over time.
>"What is actually happening"
This is again what im assuming is your own perspective on the situation, and not a explicit reading of the actual chart right? basically your rejecting the survey and its data entirely and coming to and asserting your own conclusions. conclusions which themselves have no such data to back them.
>"I didnt move. you did"
This is not what the chart says or is saying or what the data shows.